Scatter Plot Block

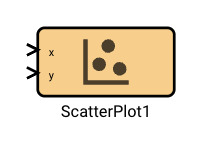
The Scatter Plot block renders a plot of two signals along two axes, with the first signal mapping to the x (horizontal) axis, and the second signal mapping to the y (vertical) axis.
Parameters
None
Examples

Press ← or → to navigate between chapters
Press S or / to search in the book
Press ? to show this help
Press Esc to hide this help

The Scatter Plot block renders a plot of two signals along two axes, with the first signal mapping to the x (horizontal) axis, and the second signal mapping to the y (vertical) axis.
None
