Plot Block
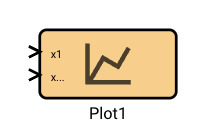
The Plot block visualizes input signals as timeseries in browser. It allows an arbitrary number of inputs. The visualization permits toggling of individual signals in the plot. Hovering over the plot window will reveal a series of icons that correspond to plot view controls and options for downloading plot data.
During Simulation Mode, the time plotted on the X-axis is simulated time, and the entire plot renders at once. When connected to real hardware, the time represents real app time, and shows up to 60 seconds of recent telemetry.
Parameters
None
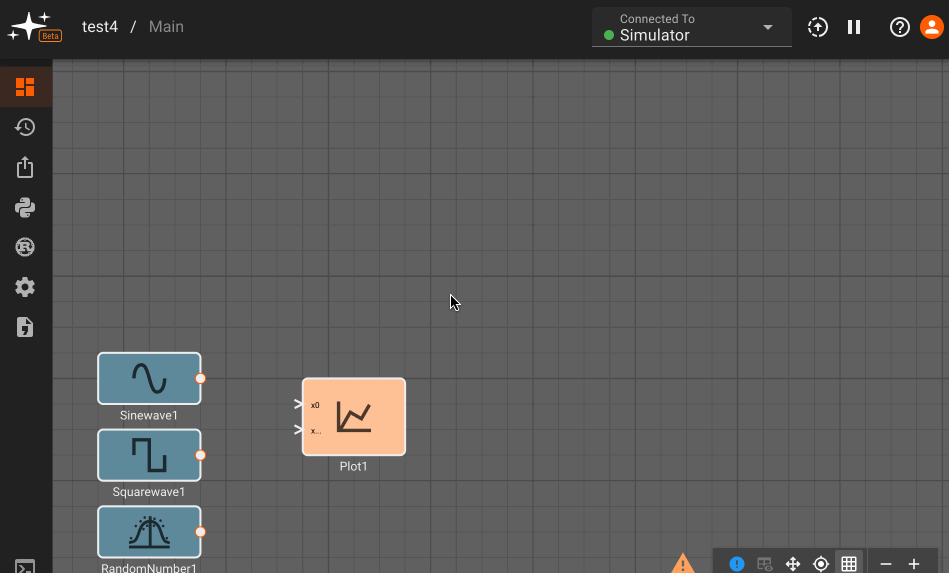
Examples